
September 29, 2026
ML foundations — reproducible experiments before model complexity
Built inspectable pandas/scikit-learn regression workflows, trained and reloaded a persisted model, and examined how evaluation splits affect claims of model quality.
Learning project
- Role
- Software engineer
- Published
- September 2026
- Focus
- Learning project
- Engineer
- Saaim Abdullah
Knowing the algorithm is not enough; the experiment must be correct
.fit() and print a score. It is harder—and much more useful—to explain what data the model saw, how inputs were shaped, whether the score is comparable across experiments, and whether an artifact behaves the same way after it is loaded again.
This body of work is foundational engineering practice, not a deployed commercial ML platform. I include it because the discipline behind evaluation, preprocessing, and reproducibility is the same discipline required in larger data and machine learning systems.
Quantified scope
| Component | Exact structure in the exercise | Engineering significance |
|---|---|---|
| Regression input features | 3 — TV, radio, newspaper spending | Multi-input feature matrix |
| Regression target | 1 — sales | Supervised continuous prediction |
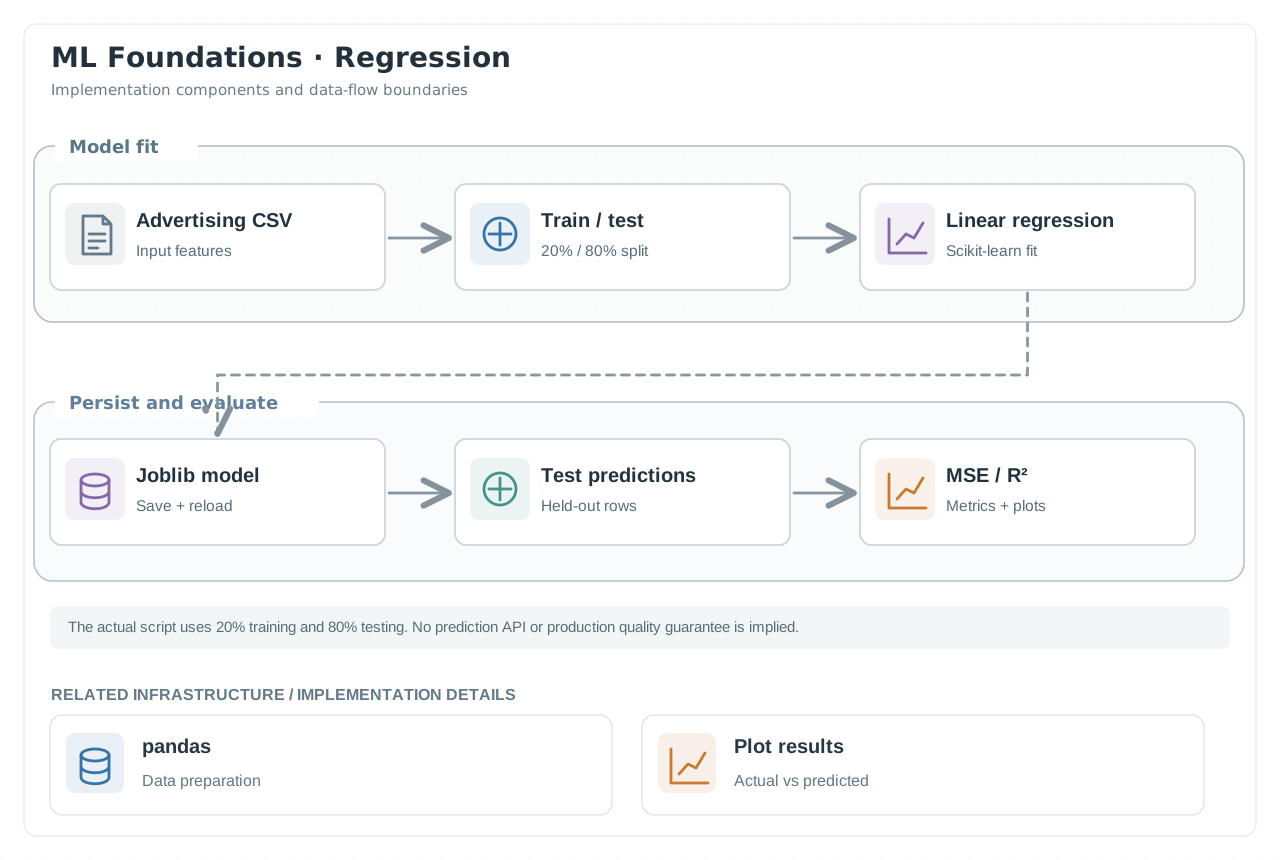
| Split recorded in script | 20% train / 80% test | Implementation fact, not an assumed standard 80/20 split |
| Named evaluation measures | 2 — MSE and R² | Error magnitude and explained variance |
| Artifact lifecycle | 2 steps — save and reload via joblib | Test that inference can run from a persisted model |
| Scientific stack | pandas, NumPy, scikit-learn | Data manipulation, numerical computation, ML pipeline |
From raw CSV to an evaluated prediction
| Stage | Implementation | What I check |
|---|---|---|
| Load | Read advertising CSV with pandas | Column names, row counts, nulls, data types |
| Select | Build X from 3 spending columns and y from sales | No target leakage into predictors |
| Split | Use deterministic random seed and test/train allocation | Repeatability and proper holdout separation |
| Train | Fit linear regression with scikit-learn | Feature shape and coefficient stability |
| Save | Serialize model with joblib | Artifact survives process boundaries |
| Reload | Load saved estimator | Predictions use saved parameters, not a new fit |
| Evaluate | Compute MSE and R²; actual-vs-predicted plot | Error and systematic residual patterns |
Why I call out the unusual split
Interpreting the numbers instead of merely printing them
| Metric | Mathematical idea | Failure mode it helps reveal |
|---|---|---|
| MSE | Average of (actual - predicted)² | Occasional very large misses |
| R² | 1 - SS_res / SS_tot | Model not beating a simple mean baseline |
| Residual visualization | Inspect error across observed sales | Trends or nonlinearity ignored by linear model |
The principles behind the smaller Python labs
Evaluation and deployment boundaries
| What is established | What still needs evidence |
|---|---|
| A reproducible training/test split exists | Sensitivity across multiple random seeds |
| A linear regression model is trained | Better-than-baseline behavior across datasets |
| A model artifact can be saved and loaded | Input schema/version metadata embedded in the artifact |
| MSE and R² are computed | Repeated cross-validation and uncertainty ranges |
| Basic data operations are exercised | Automated pipeline and production inference service |
Result
Pipeline that owns preprocessing and prediction together, add schema validation, compare against a DummyRegressor, and run repeated validation with recorded seeds. That would make this foundation a stronger quantitative case study without pretending it is already a production ML service.
Code and experiments
More to explore
Sep 29, 2026
Sep 29, 2026
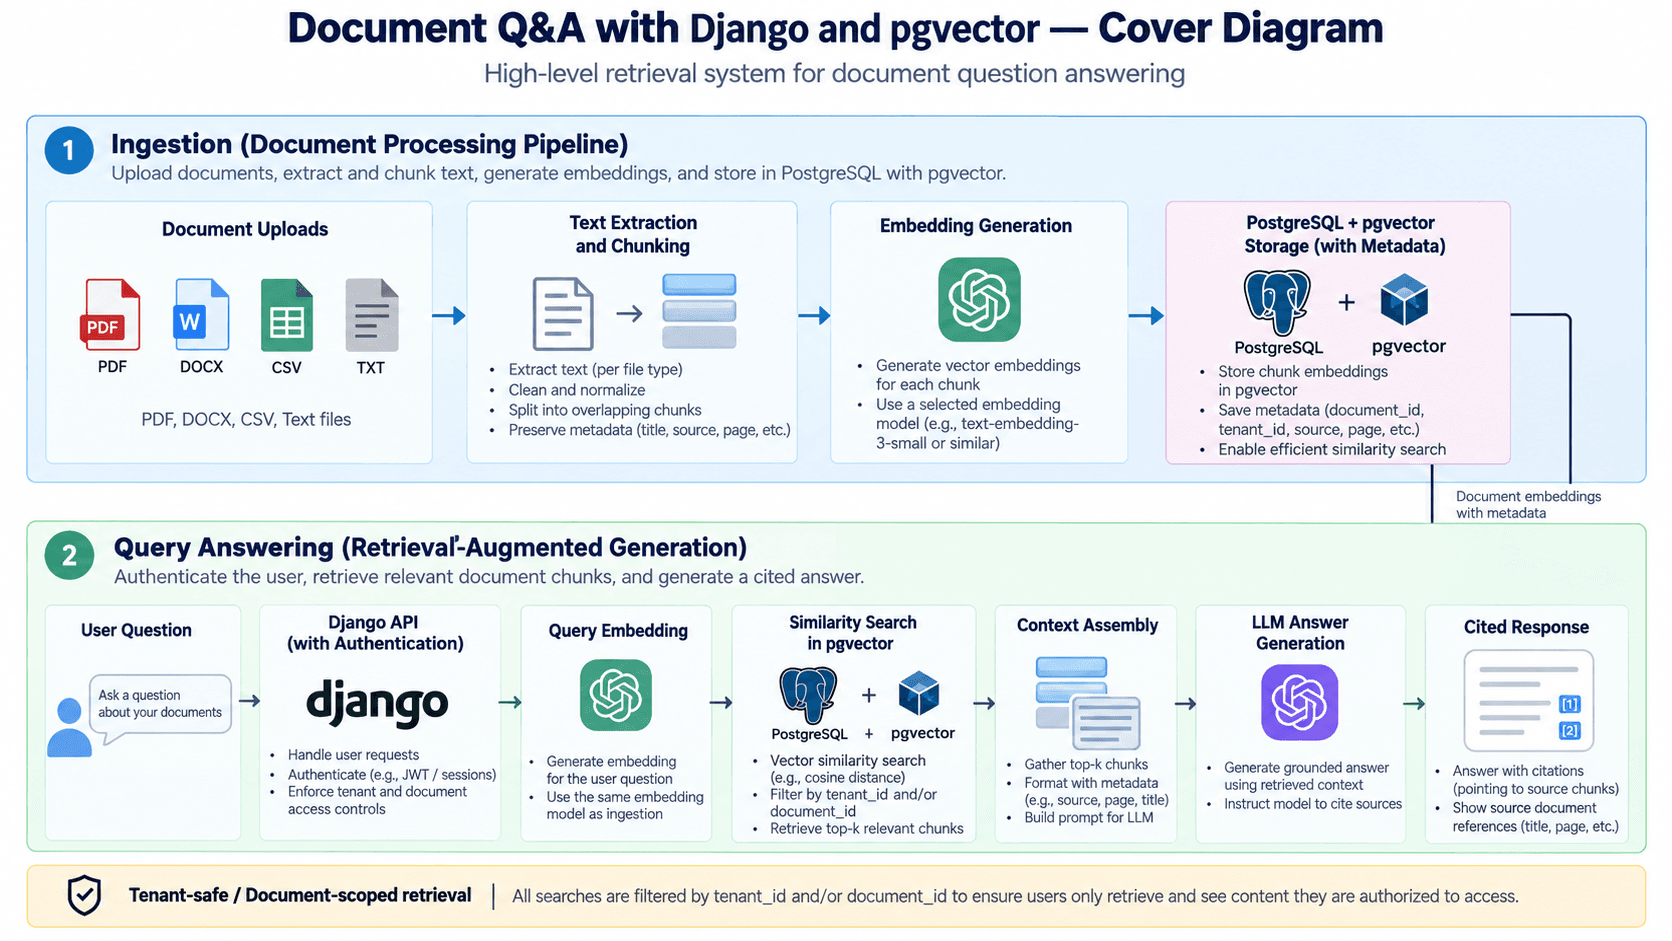
Document Q&A — building a retrieval system that knows when not to answer
Designed a 768-dimensional pgvector search pipeline with 3 API operations, bounded retrieval, batch ingestion, and failure-aware generation.
View projectPersonal prototype
Sep 29, 2026
Sep 29, 2026
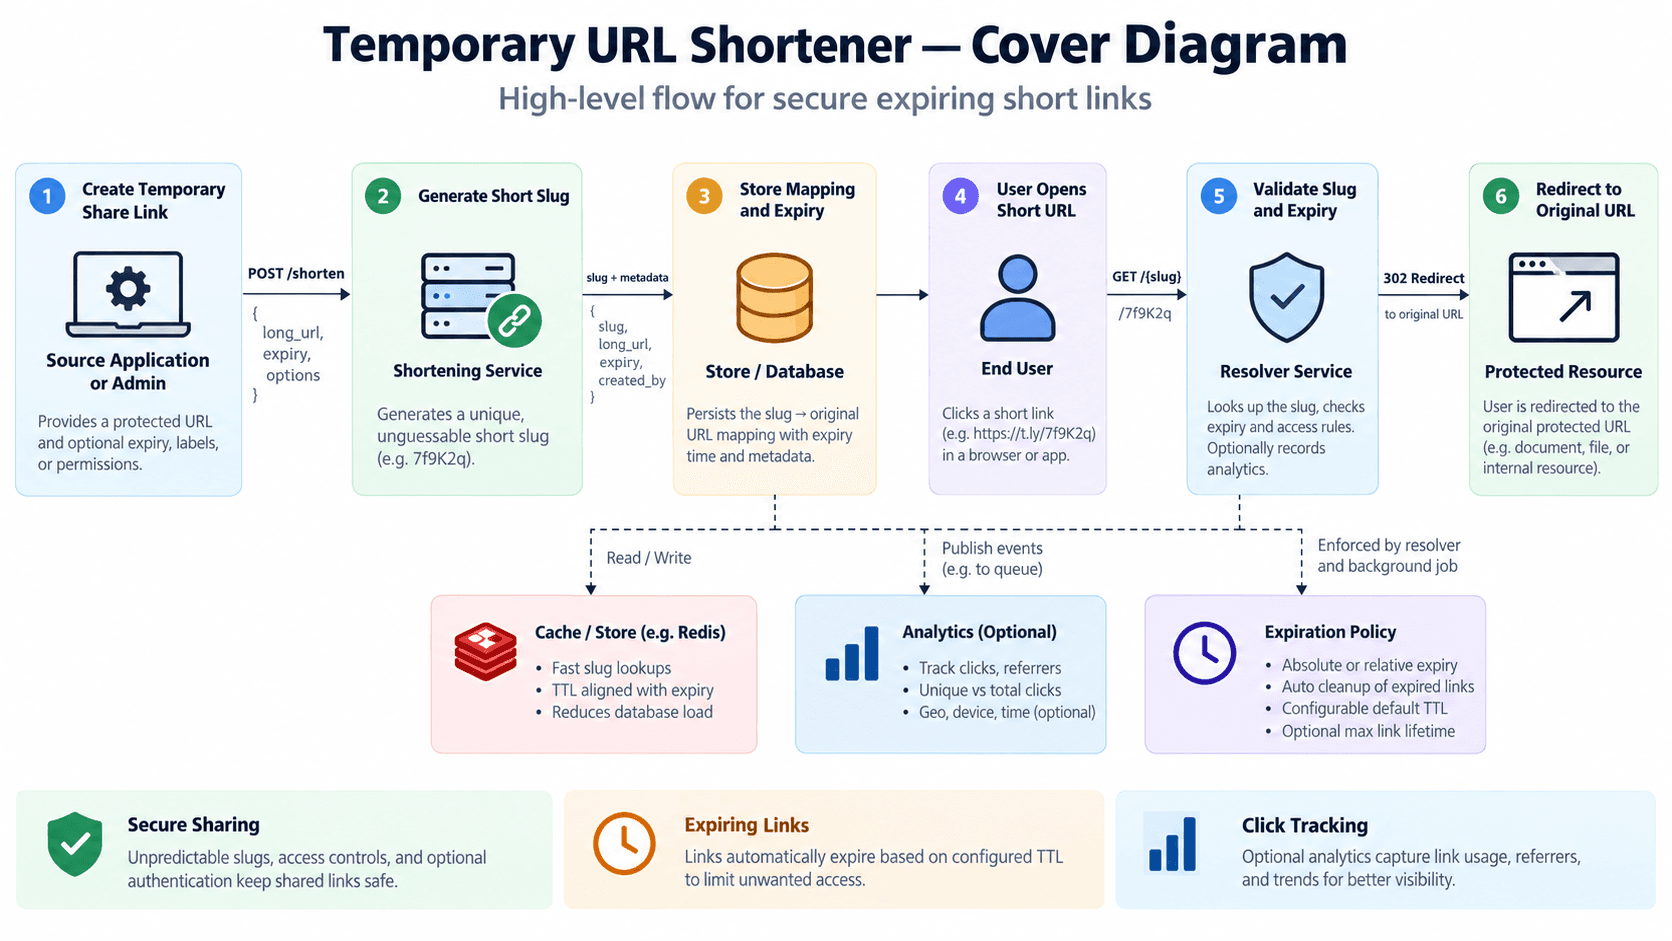
Expiring URL service — designing a small API around explicit failure modes
Implemented 8-character aliases, create/redirect/lookup operations, scheduled expiry, and a health endpoint in Express.
View projectPersonal prototype
SaaimOpen to full-time roles, contract work, and conversations about things worth building.